Logging & monitoring
Logs
We strongly recommend storing logs in one centralized place when working in a clustered environment. MongooseIM uses the standard OTP logging framework: Logger. Its handlers can be replaced and customised, according to Logger's documentation.
Syslog integration
MongooseIM uses syslogger as a Logger handler for syslog.
To activate it you have to add syslogger to the applications section in src/mongooseim/app.src:
1 | |
You also need to edit rel/files/app.config and uncomment the lines:
1 2 3 4 5 6 7 8 | |
You can provide different parameters to change the handler's behaviour as described
in the syslogger's GitHub page:
ident- a string to tag all the syslog messages with. The default ismongooseim.facility- the facility to log to (see the syslog documentation).log_opts- see the syslog documentation for the description.
Depending on the system you use, remember to also add the appropriate line in the syslog config file.
For example, if the facility local0 is set:
1 | |
All the logs of level info should be passed to the /var/log/mongooseim.log file.
Example log (e.g tail -f /var/log/mongooseim.log):
1 | |
Further / multiserver integration
For more advanced processing and analysis of logs, including gathering logs from multiple machines, you can use one of the many available systems (e.g. logstash/elasticsearch/kibana, graylog, splunk), by redirecting mongoose logs to such service with an appropriate Logger's handler.
Check Logging for more information.
Monitoring
WombatOAM
WombatOAM is an operations and maintenance framework for Erlang based systems. Its Web Dashboard displays this data in an aggregated manner. Additionally, WombatOAM provides interfaces to feed the data to other OAM tools such as Graphite, Nagios or Zabbix.
For more information see: WombatOAM.
graphite-collectd
To monitor MongooseIM during load testing, we recommend the following open source applications:
- Grafana is used for data presentation.
- Graphite is a server used for metrics storage.
- collectd is a daemon running on the monitored nodes capturing data related to CPU and Memory usage, IO etc.
Plug-in Exometer reporters
MongooseIM uses a fork of Exometer library for collecting metrics.
Exometer has many plug-in reporters that can send metrics to external services. We maintain exometer_report_graphite and exometer_report_statsd for Graphite and StatsD respectively.
It is possible to enable them in MongooseIM via the app.config file.
The file sits next to the mongooseim.toml file in the rel/files and _REL_DIR_/etc directories.
Below you can find a sample configuration. It shows setting up a reporter connecting to graphite running on localhost.
You can see an additional option not listed in the Exometer docs - mongooseim_report_interval, which sets the metrics' resolution, i.e. how often Exometer gathers and sends metrics through reporters.
By default, the resolution is set to 60 seconds.
1 2 3 4 5 6 7 8 9 10 11 12 13 14 15 16 | |
Run Graphite & Grafana in Docker - quick start
The following commands will download the latest version of kamon/grafana_graphite docker image that contains both Grafana and Graphite, and start them while mounting the local directory ./docker-grafana-graphite-master/data for metric persistence:
1 2 | |
Go to http://localhost:80 to view the Grafana dashboard that's already set up to use metrics from Graphite.
Add metrics to Grafana dashboard
We recommend the following metrics as a baseline for tracking your MongooseIM installation.
For time-based metrics, you can choose to display multiple calculated values for a reporting period - we recommend tracking at least max, median and mean.
1 2 3 4 5 6 7 8 9 10 11 12 13 | |
Note that RDBMS metrics are only relevant if MongooseIM is configured with an RDBMS backend, MAM metrics when mod_mam is enabled and MAM flush times when MAM is configured with an RDBMS backend with async_writer option (default).
Example graph in Grafana
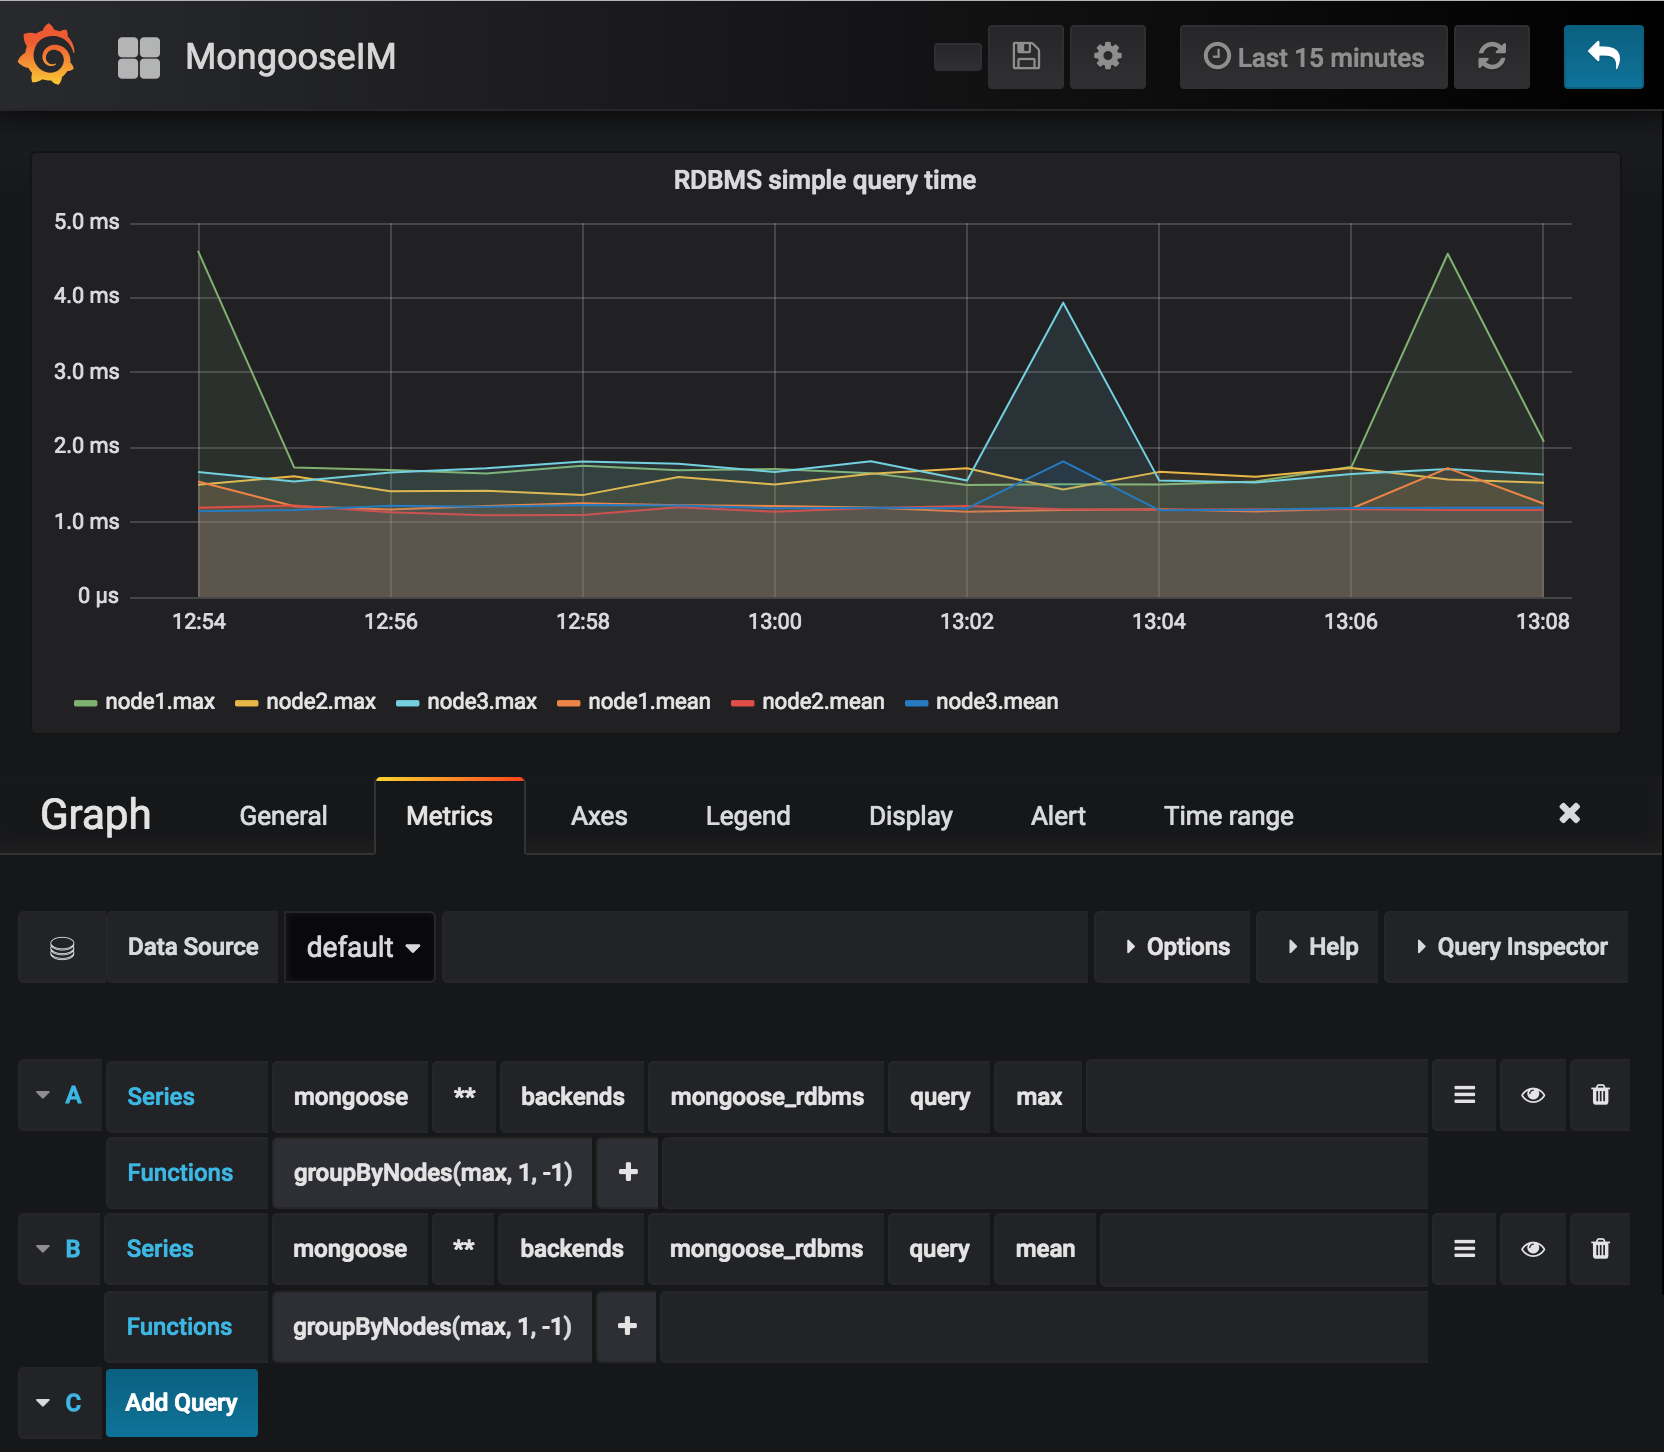
This screenshot shows a graph plotting the RDBMS simple query time metric mentioned above.
The graph is plotted for three nodes with each node having a different prefix: mongoose.node1, mongoose.node2 and mongoose.node3.
The queries take metrics for all nodes and all domains (** is a wildcard for multiple parts of the metric name) and group them per-node and per-value-type (respectively 1st and -1st part of the metric's name).
Parts of the names are indexed from 0.
Time-based metrics in MongooseIM are given in microseconds, so to display human-readable values in graph's legend, the Y-axis unit has to be edited on the Axes tab.